Comparative assessment of commonly used color lookup tables to determine key performance indicators for perfusion map data visualization
DOI:
https://doi.org/10.15587/2706-5448.2026.352787Keywords:
colormap, color perception, color visualization, hemodynamic parameters, perfusion-weighted imagesAbstract
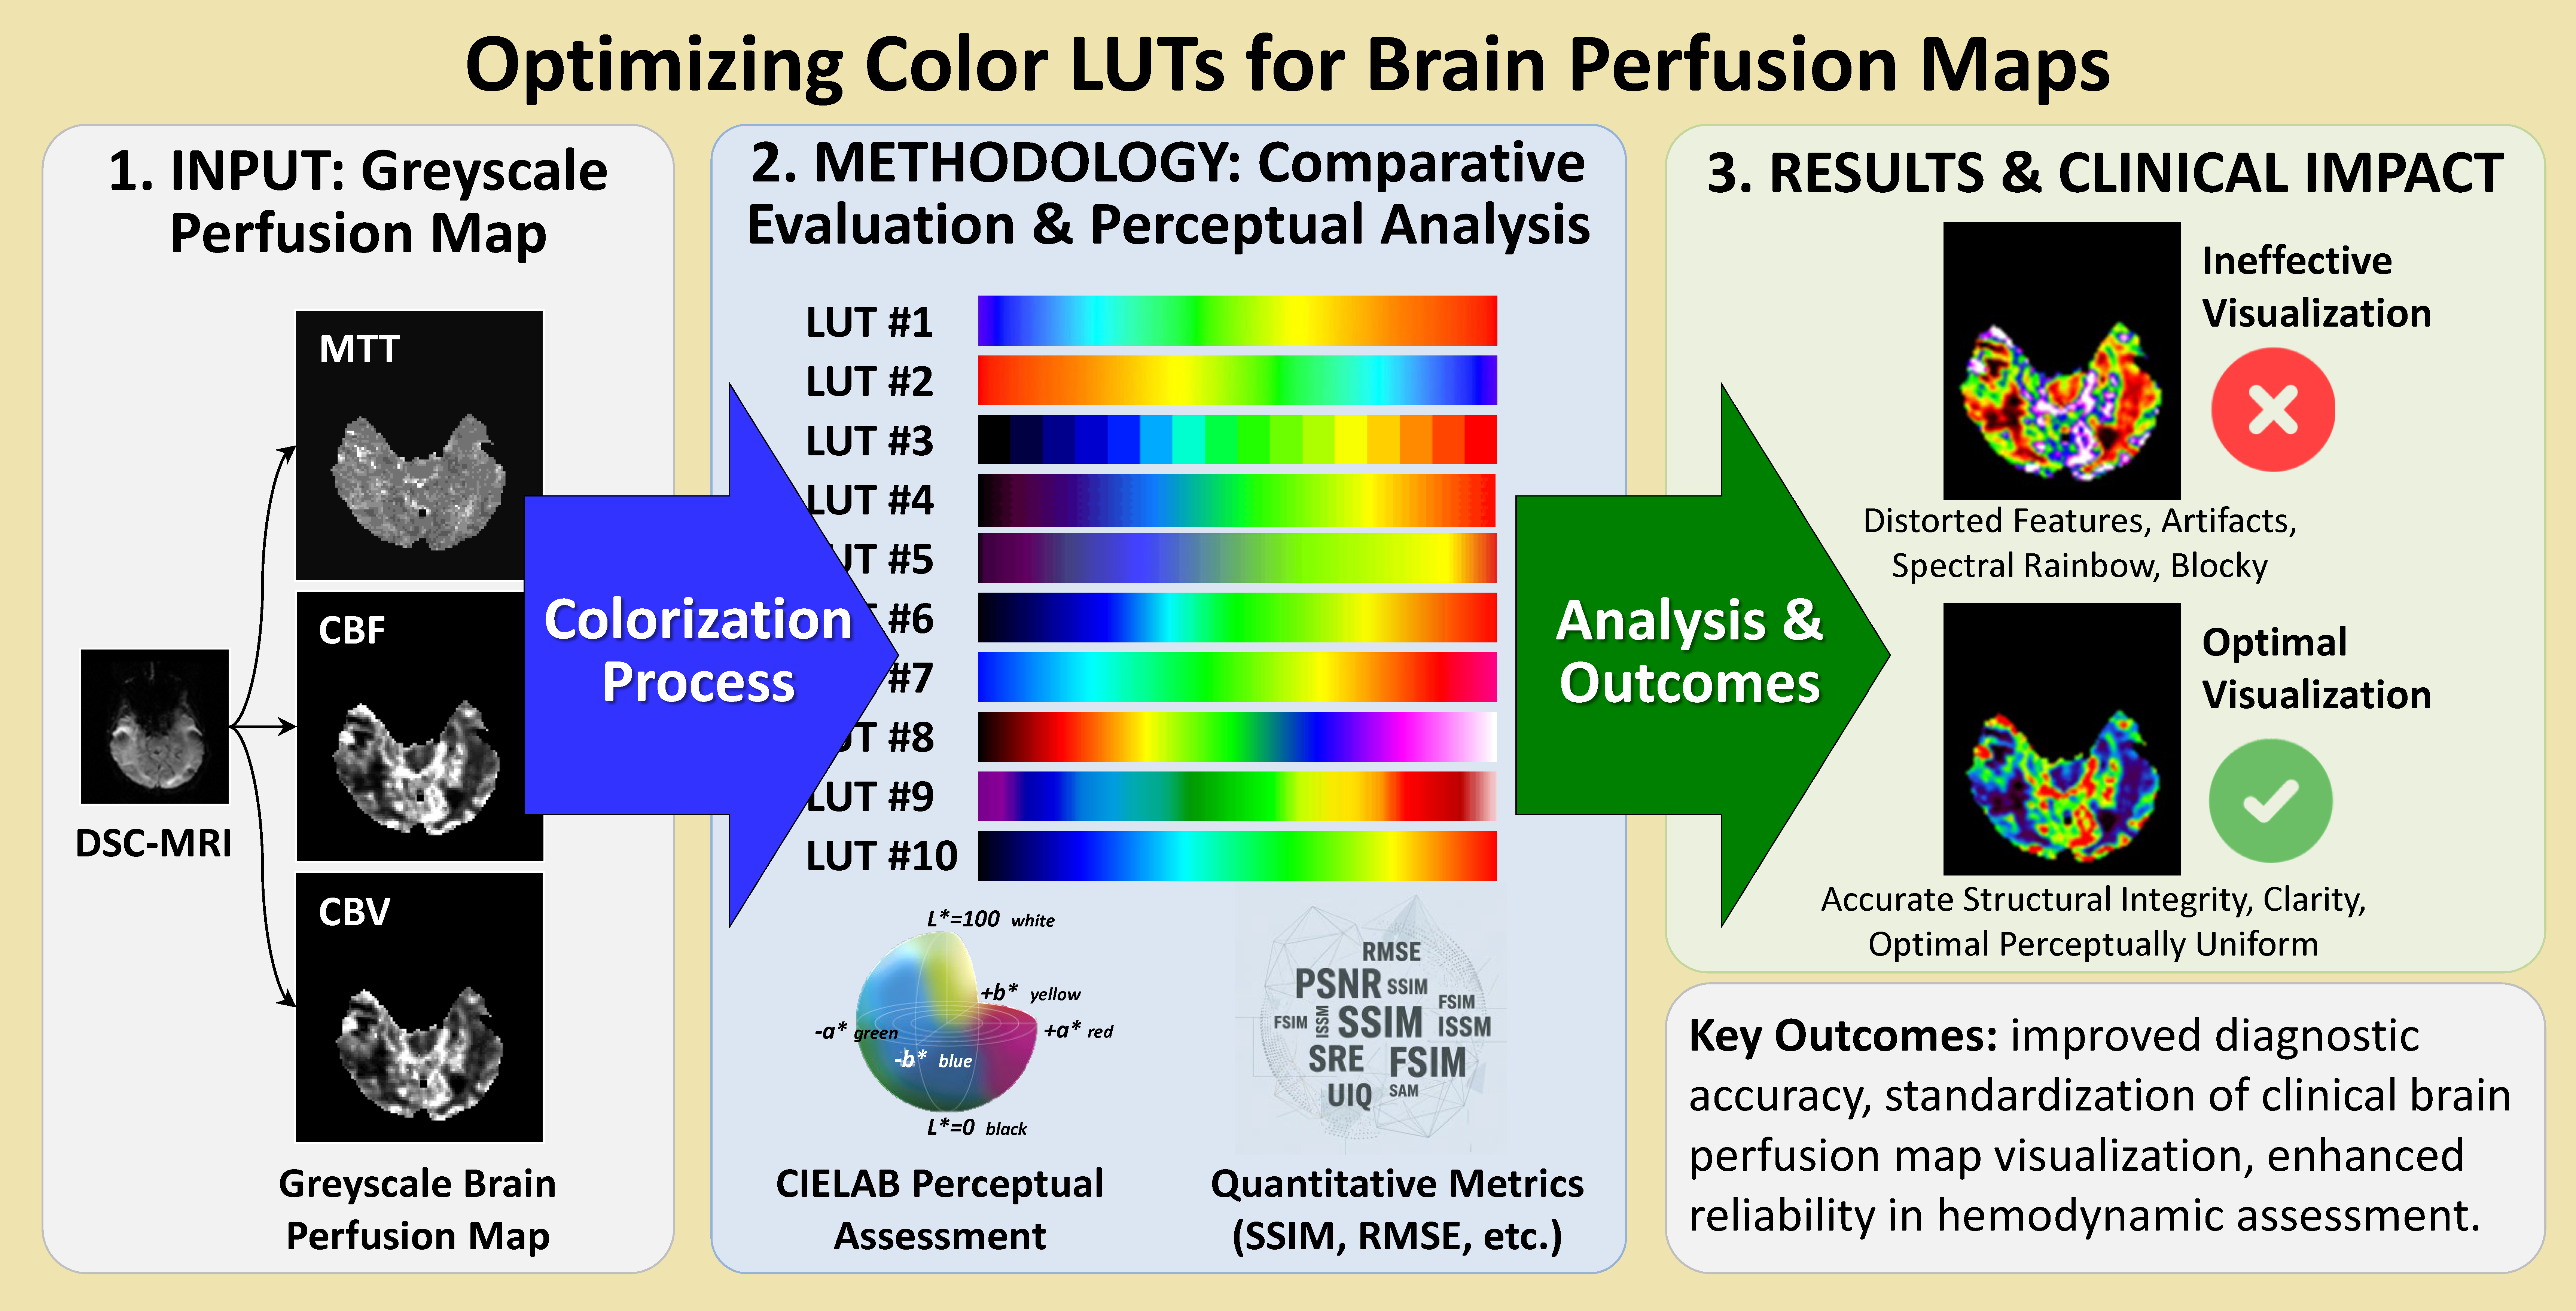
The object of this research is color lookup table schemes that are most commonly used to visualize perfusion maps in the scope of assessment of brain hemodynamic parameters. The problem is that such color schemes differ significantly in the number of colors, their distribution, and the rules for converting grayscale image data into color. As a result, the same perfusion map may appear different depending on the selected scheme, which complicates the visual assessment of hemodynamic parameters and significantly biases the precision of their interpretation.
The research provides a comprehensive analysis of the ten commonly used color lookup table schemes for perfusion map visualization. Assessment of both direct schemes and patient-derived data is provided. Among quantitative metrics are RMSE, PSNR, SSIM, FSIM, ISSM, SRE, SAM, and UIQ. The CIELAB color space is used to provide a perceptual assessment of the color impact across neighboring levels in the schemes. It also used to analyze the relationship between local intensity differences in greyscale perfusion maps and resulting color perceptual differences once the lookup table is applied. Analysis reveals that the selection of color lookup table schemes is critical for preserving signal intensity and structural integrity. Spectral rainbow and block-structured schemes lag behind others in performance, making them less effective due to distorted structural features.
The results can be applied in practice to visualize perfusion map data in medical software to assess key hemodynamic parameters, such as blood volume, blood flow, and mean transit time. Also, the results can be helpful for standardization and selecting optimal color lookup table schemes in clinical practice, and for validating algorithms used to calculate perfusion maps during medical software development.
References
- Putowski, Z., Bakker, J., Kattan, E., Hernández, G., Ait-Oufella, H., Szczeklik, W., Guerci, P. (2025). Tissue perfusion as the ultimate target of hemodynamic interventions in the perioperative period. Journal of Clinical Anesthesia, 107, 112009. https://doi.org/10.1016/j.jclinane.2025.112009
- Lipiński, S. (2024). Creation of a Simulated Sequence of Dynamic Susceptibility Contrast–Magnetic Resonance Imaging Brain Scans as a Tool to Verify the Quality of Methods for Diagnosing Diseases Affecting Brain Tissue Perfusion. Computation, 12 (3), 54. https://doi.org/10.3390/computation12030054
- Sobhan, R., Gkogkou, P., Johnson, G., Cameron, D. (2023). Model-based deconvolution for DSC-MRI: A comparison of accuracy, precision, and computational complexity of parametric transit time distributions. https://doi.org/10.1101/2023.02.12.528216
- Sorokina, V. V., Alkhimova, S. M. (2024). Analiz zastosuvannia tablyts vidpovidnosti koloriv dlia vizualizatsii danykh perfuziinykh kart. World Ways and Methods of Improving Outdated Theories and Trends, 380–385. Available at: https://isg-konf.com/world-ways-and-methods-of-improving-outdated-theories-and-trends/
- Căiniceanu, A.-M.-A., Alexa, F. (2025). Application of Color Theory in Graphic Design. 2025 18th International Conference on Engineering of Modern Electric Systems (EMES). IEEE 1–6. https://doi.org/10.1109/emes65692.2025.11045619
- Furmanová, K., Kozlíková, B., Höllt, T., Gröller, M. E., Preim, B., Raidou, R. G. (2025). BioMedical Visualization. Synthesis Lectures on Visualization. Springer Nature Switzerland. https://doi.org/10.1007/978-3-031-66789-3
- Preim, B., Oeltze, S., Mlejnek, M., Groeller, E., Hennemuth, A., Behrens, S. (2009). Survey of the Visual Exploration and Analysis of Perfusion Data. IEEE Transactions on Visualization and Computer Graphics, 15 (2), 205–220. https://doi.org/10.1109/tvcg.2008.95
- Garrison, L. A., Kolesar, I., Viola, I., Hauser, H., Bruckner, S. (2022). Trends & Opportunities in Visualization for Physiology: A Multiscale Overview. Computer Graphics Forum, 41 (3), 609–643. https://doi.org/10.1111/cgf.14575
- Crameri, F., Shephard, G. E., Heron, P. J. (2020). The misuse of colour in science communication. Nature Communications, 11 (1). https://doi.org/10.1038/s41467-020-19160-7
- Moreland, K. (2016). Why We Use Bad Color Maps and What You Can Do About It. Electronic Imaging, 28 (16), 1–6. https://doi.org/10.2352/issn.2470-1173.2016.16.hvei-133
- Reda, K. (2023). Rainbow Colormaps: What are They Good and Bad for? IEEE Transactions on Visualization and Computer Graphics, 29 (12), 5496–5510. https://doi.org/10.1109/tvcg.2022.3214771
- Liu, Y., Heer, J. (2018). Somewhere Over the Rainbow. Proceedings of the 2018 CHI Conference on Human Factors in Computing Systems, 1–12. https://doi.org/10.1145/3173574.3174172
- Stoelzle, M., Stein, L. (2021). Rainbow color map distorts and misleads research in hydrology – guidance for better visualizations and science communication. Hydrology and Earth System Sciences, 25 (8), 4549–4565. https://doi.org/10.5194/hess-25-4549-2021
- Silva, S., Sousa Santos, B., Madeira, J. (2011). Using color in visualization: A survey. Computers & Graphics, 35 (2), 320–333. https://doi.org/10.1016/j.cag.2010.11.015
- Sibrel, S. C., Rathore, R., Lessard, L., Schloss, K. B. (2020). The relation between color and spatial structure for interpreting colormap data visualizations. Journal of Vision, 20 (12), 7. https://doi.org/10.1167/jov.20.12.7
- Zabala-Travers, S., Choi, M., Cheng, W.-C., Badano, A. (2015). Effect of color visualization and display hardware on the visual assessment of pseudocolor medical images. Medical Physics, 42 (6), 2942–2954. https://doi.org/10.1118/1.4921125
- Nuñez, J. R., Anderton, C. R., Renslow, R. S. (2018). Optimizing colormaps with consideration for color vision deficiency to enable accurate interpretation of scientific data. PLOS ONE, 13 (7), e0199239. https://doi.org/10.1371/journal.pone.0199239
- Ware, C., Turton, T. L., Bujack, R., Samsel, F., Shrivastava, P., Rogers, D. H. (2019). Measuring and Modeling the Feature Detection Threshold Functions of Colormaps. IEEE Transactions on Visualization and Computer Graphics, 25 (9), 2777–2790. https://doi.org/10.1109/tvcg.2018.2855742
- Sollmann, N., Fuderer, M., Crameri, F., Weingärtner, S., Baeßler, B., Gulani, V. et al. (2024). Color Maps: Facilitating the Clinical Impact of Quantitative MRI. Journal of Magnetic Resonance Imaging, 61 (4), 1572–1579. https://doi.org/10.1002/jmri.29573
- deSouza, N. M., Fuderer, M., Sollmann, N., Wichtmann, B. D., Golay, X. (2025). Colour map displays. Insights into Imaging, 16 (1). https://doi.org/10.1186/s13244-025-01970-2
- Qutbi, M. (2024). Quantitative Performance Evaluation of Commonly Used Colormaps for Image Display in Myocardial Perfusion Imaging: Analysis based on Perceptual Metrics. Molecular Imaging and Radionuclide Therapy, 33 (2), 94–105. https://doi.org/10.4274/mirt.galenos.2024.34711
- The Cancer Genome Atlas Program (TCGA). Cancer.gov. Available at: http://cancergenome.nih.gov/
- Jain, R., Poisson, L., Narang, J., Gutman, D., Scarpace, L., Hwang, S. N. et al. (2013). Genomic Mapping and Survival Prediction in Glioblastoma: Molecular Subclassification Strengthened by Hemodynamic Imaging Biomarkers. Radiology, 267 (1), 212–220. https://doi.org/10.1148/radiol.12120846
- Alkhimova, S., Krenevych, A. (2019). Brain tissues segmentation on mr perfusion images using CUSUM filter for boundary pixels. International Journal of Computing, 18 (2), 127–134. https://doi.org/10.47839/ijc.18.2.1411
- Alkhimova, S. (2019). CUSUM Filter for Brain Segmentation on DSC Perfusion MR Head Scans with Abnormal Brain Anatomy. Proceedings of the 2019 International Conference on Intelligent Medicine and Image Processing, 43–47. https://doi.org/10.1145/3332340.3332357
- Kudo, K., Sasaki, M., Yamada, K., Terae, S., Tha, K. K., Yoshida, Y., Miyasaka, K. (2006). Evaluation and minimization of the difference in MR perfusion maps among software. Proceedings of the 14th Annual Meeting of ISMRM, 3558. Available at: https://cds.ismrm.org/protected/06MProceedings/PDFfiles/03558.pdf
- Kudo, K. (2005). Acute Stroke Imaging Standardization Group Japan recommended standard LUT (a-LUT) for perfusion color maps.
- Schanda, J. (Ed.) (2007). Colorimetry: understanding the CIE system. John Wiley & Sons. https://doi.org/10.1002/9780470175637
- Sara, U., Akter, M., Uddin, M. S. (2019). Image Quality Assessment through FSIM, SSIM, MSE and PSNR – A Comparative Study. Journal of Computer and Communications, 7 (3), 8–18. https://doi.org/10.4236/jcc.2019.73002
- Sampat, M. P., Zhou Wang, Gupta, S., Bovik, A. C., Markey, M. K. (2009). Complex Wavelet Structural Similarity: A New Image Similarity Index. IEEE Transactions on Image Processing, 18 (11), 2385–2401. https://doi.org/10.1109/tip.2009.2025923
- Lin Zhang, Lei Zhang, Xuanqin Mou, Zhang, D. (2011). FSIM: A Feature Similarity Index for Image Quality Assessment. IEEE Transactions on Image Processing, 20 (8), 2378–2386. https://doi.org/10.1109/tip.2011.2109730
- Aljanabi, M. A., Hussain, Z. M., Shnain, N. A. A., Lu, S. F. (2019). Design of a hybrid measure for image similarity: a statistical, algebraic, and information-theoretic approach. European Journal of Remote Sensing, 52, 2–15. https://doi.org/10.1080/22797254.2019.1628617
- Nordio, A., Chiasserini, C.-F., Viterbo, E. (2009). Signal Reconstruction Errors in Jittered Sampling. IEEE Transactions on Signal Processing, 57 (12), 4711–4718. https://doi.org/10.1109/tsp.2009.2027404
- Yuhas, R. H., Goetz, A. F., Boardman, J. W. (1992). Discrimination among semi-arid landscape endmembers using the spectral angle mapper (SAM) algorithm. JPL, Summaries of the Third Annual JPL Airborne Geoscience Workshop. Volume 1: AVIRIS Workshop. Available at: https://ntrs.nasa.gov/citations/19940012193
- Zhou Wang, Bovik, A. C. (2002). A universal image quality index. IEEE Signal Processing Letters, 9 (3), 81–84. https://doi.org/10.1109/97.995823
Downloads
Published
How to Cite
Issue
Section
License
Copyright (c) 2026 Svitlana Alkhimova, Viktoriia Sorokina, Illia Kabala

This work is licensed under a Creative Commons Attribution 4.0 International License.
The consolidation and conditions for the transfer of copyright (identification of authorship) is carried out in the License Agreement. In particular, the authors reserve the right to the authorship of their manuscript and transfer the first publication of this work to the journal under the terms of the Creative Commons CC BY license. At the same time, they have the right to conclude on their own additional agreements concerning the non-exclusive distribution of the work in the form in which it was published by this journal, but provided that the link to the first publication of the article in this journal is preserved.