Visual identification of some regularities in packet network traffic
DOI:
https://doi.org/10.15587/1729-4061.2024.299002Keywords:
UDP, AR-estimation, moving window, packet intensity, long-term trend, high-frequency componentAbstract
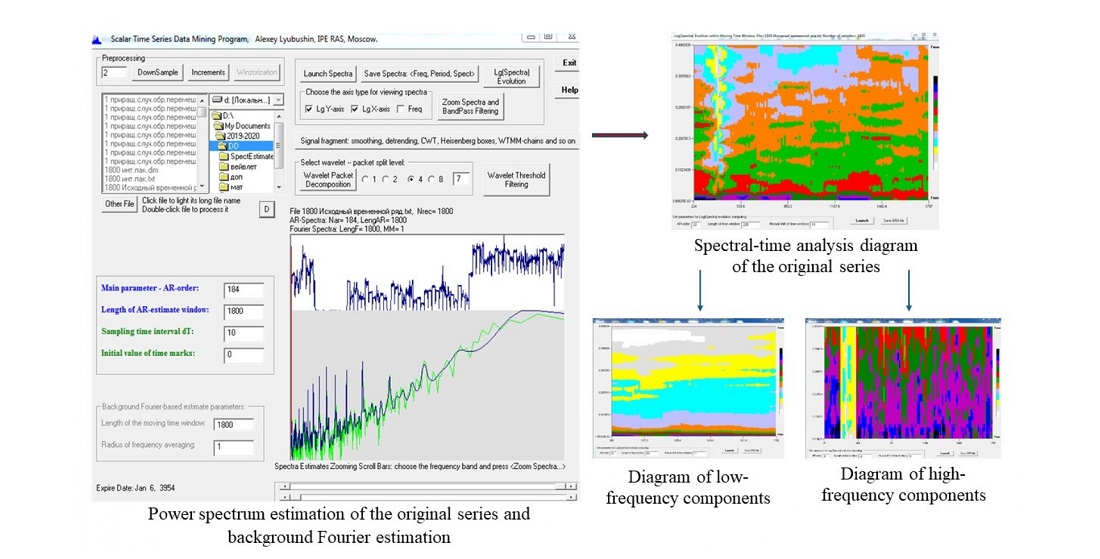
Modern heterogeneous packet networks generate network traffic with a complex structure. In this article, the object of study is a time series. The total number of User Datagram Protocol (UDP) packets has reached 250242. According to analysts, the growth trend of traffic, including real-time applications, will continue and the volume of data will grow, which may lead to the formation of packet queues when processed by network devices. In this case, there may be losses in case of long queues. To solve this problem, a power spectrum assessment was carried out. The AR maximum entropy estimator has been shown to be more sensitive than the auxiliary Fourier estimator.
Accounting for non-stationarity by spectral methods is possible only through estimation in a sliding time window. Nine diagrams of spectral-temporal analysis of the original series, its increments, and the mixed series of increments were obtained: with default parameters, with small and large windows. Diagrams related to the original series reflect the dynamics of changes in data transmission intensity in the network; they show higher temporal resolution, indicating the presence of high-frequency components (noise) and the presence of low-frequency components (trend). Diagrams with increments describe signals of periodic components; changing the length of the window did not reflect the presence of noise or trend signs. Diagrams with mixed increments show that frequency components are uniformly distributed. The uniqueness of this work lies in the real measured data, and a distinctive feature of the obtained results is the visual examination of the complex traffic structure, allowing for the resolution of the investigated problem. Practical application of the results obtained can be applied in Quality of Service (QoS) management, resource planning, and network performance optimization
References
- Andronov, I. L., Naumova, A. V. (2013). Program WWZ: wavelet analysis of astronomical signals with irregularly spaced arguments. Odessa Astronomical Publications, 26 (1). https://doi.org/10.48550/arXiv.1310.5031
- Ledoit, O., Wolf, M. (2017). Analytical nonlinear shrinkage of large-dimensional covariance matrices. University of Zurich, 56. Available at: https://www.econ.uzh.ch/apps/workingpapers/wp/econwp264.pdf
- Huang, N. E., Chen, X., Lo, M.-T., Wu, Z. (2011). On hilbert spectral representation: a true time-frequency representation for nonlinear and nonstationary data. Advances in Adaptive Data Analysis, 03 (01n02), 63–93. https://doi.org/10.1142/s1793536911000659
- Dettinger, M. D., Ghil, M., Strong, C. M., Weibel, W., Yiou, P. (1995). Software expedites singular‐spectrum analysis of noisy time series. Eos, Transactions American Geophysical Union, 76 (2), 12–21. https://doi.org/10.1029/eo076i002p00012
- Ghaderpour, E., Vujadinovic, T. (2020). The Potential of the Least-Squares Spectral and Cross-Wavelet Analyses for Near-Real-Time Disturbance Detection within Unequally Spaced Satellite Image Time Series. Remote Sensing, 12 (15), 2446. https://doi.org/10.3390/rs12152446
- Tzallas, A. T., Tsipouras, M. G., Fotiadis, D. I. (2009). Epileptic Seizure Detection in EEGs Using Time-Frequency Analysis. IEEE Transactions on Information Technology in Biomedicine, 13 (5), 703–710. https://doi.org/10.1109/titb.2009.2017939
- Yan, X., Yang, D., Lin, Z., Vucetic, B. (2022). Significant Low-Dimensional Spectral-Temporal Features for Seizure Detection. IEEE Transactions on Neural Systems and Rehabilitation Engineering, 30, 668–677. https://doi.org/10.1109/tnsre.2022.3156931
- Ghaderpour, E., Pagiatakis, S. D., Hassan, Q. K. (2021). A Survey on Change Detection and Time Series Analysis with Applications. Applied Sciences, 11 (13), 6141. https://doi.org/10.3390/app11136141
- Guo, Q., Zhang, J., Zhong, C., Zhang, Y. (2021). Change Detection for Hyperspectral Images Via Convolutional Sparse Analysis and Temporal Spectral Unmixing. IEEE Journal of Selected Topics in Applied Earth Observations and Remote Sensing, 14, 4417–4426. https://doi.org/10.1109/jstars.2021.3074538
- Singh, P., Joshi, S. D., Patney, R. K., Saha, K. (2017). The Fourier decomposition method for nonlinear and non-stationary time series analysis. Proceedings of the Royal Society A: Mathematical, Physical and Engineering Sciences, 473 (2199), 20160871. https://doi.org/10.1098/rspa.2016.0871
- Tang, Z., Amatulli, G., Pellikka, P. K. E., Heiskanen, J. (2021). Spectral Temporal Information for Missing Data Reconstruction (STIMDR) of Landsat Reflectance Time Series. Remote Sensing, 14 (1), 172. https://doi.org/10.3390/rs14010172
- Yin, J., Cao, J., Siuly, S., Wang, H. (2019). An Integrated MCI Detection Framework Based on Spectral-temporal Analysis. International Journal of Automation and Computing, 16 (6), 786–799. https://doi.org/10.1007/s11633-019-1197-4
- Wu, Z., Tan, Z.-M., Pietrafesa, L. (2023). Spectral analysis of a time series: From an additive perspective to a multiplicative perspective. Applied and Computational Harmonic Analysis, 63, 94–112. https://doi.org/10.1016/j.acha.2022.11.005
- Harris, F. J. (1978). On the use of windows for harmonic analysis with the discrete Fourier transform. Proceedings of the IEEE, 66 (1), 51–83. https://doi.org/10.1109/proc.1978.10837
- Oppenheim, A. V., Schafer, R. W. (2010). Discrete-time signal processing. Pearson. Available at: https://media.pearsoncmg.com/ph/esm/ecs_oppenheim_dtsp_3/contents/index.htm
- Das, S., Subba Rao, S., Yang, J. (2021). Spectral methods for small sample time series: A complete periodogram approach. Journal of Time Series Analysis, 42 (5-6), 597–621. https://doi.org/10.1111/jtsa.12584
Downloads
Published
How to Cite
Issue
Section
License
Copyright (c) 2024 Sharafat Mirzakulova, Zhanar Ibrayeva, Saule Kuanova, Aisha Mamyrova, Bakyt Japparkulov, Ruslan Kamal

This work is licensed under a Creative Commons Attribution 4.0 International License.
The consolidation and conditions for the transfer of copyright (identification of authorship) is carried out in the License Agreement. In particular, the authors reserve the right to the authorship of their manuscript and transfer the first publication of this work to the journal under the terms of the Creative Commons CC BY license. At the same time, they have the right to conclude on their own additional agreements concerning the non-exclusive distribution of the work in the form in which it was published by this journal, but provided that the link to the first publication of the article in this journal is preserved.
A license agreement is a document in which the author warrants that he/she owns all copyright for the work (manuscript, article, etc.).
The authors, signing the License Agreement with TECHNOLOGY CENTER PC, have all rights to the further use of their work, provided that they link to our edition in which the work was published.
According to the terms of the License Agreement, the Publisher TECHNOLOGY CENTER PC does not take away your copyrights and receives permission from the authors to use and dissemination of the publication through the world's scientific resources (own electronic resources, scientometric databases, repositories, libraries, etc.).
In the absence of a signed License Agreement or in the absence of this agreement of identifiers allowing to identify the identity of the author, the editors have no right to work with the manuscript.
It is important to remember that there is another type of agreement between authors and publishers – when copyright is transferred from the authors to the publisher. In this case, the authors lose ownership of their work and may not use it in any way.